Plant output mismatch is costly because it rarely appears as one obvious failure. It appears as waiting product, rushed cleaning, label drift, spare-parts stress, and staff improvisation. That is the reason this article starts with the operating decision rather than a product slogan.
One filling line should be sized around the product family, package mix, shift pattern, and support model rather than one headline bottles-per-hour number. Public details from MassTechX beverage filling equipment are used here as a reference for the questions a buyer should document before specifying a line.
Line sizing mismatch hides in the calendar
Output planning mismatch rarely announces itself as one large error. It appears as missed shifts, waiting product, extra cleaning time, label rework, hurried maintenance, and an operations team that slowly adjusts the plan away from the sales promise.
Practically, the buyer should therefore define capacity as a plant condition, not a catalog number. The public Mass Technology reference lists 2,000-36,000 BPH across beverage filling equipment, but the right number depends on product, package, treatment, labeling, and service recovery.
Capacity model Fit Gate before line approval
Viewed from procurement, the gate below forces the team to compare the main filler with upstream supply, downstream packaging, and service tolerance. It is designed to stop a project from accepting a large BPH number while ignoring the stations that make the number possible.
Use the gate during supplier selection and again before payment. When any row is unanswered, the buyer should treat that item as an assumption, not a confirmed line capability.
Plant output Fit Gate
Review area |
Action for the buyer |
Risk if ignored |
Main filler |
Measure rated speed against actual shift time, cleaning time, and changeover time. |
Nameplate speed is not daily output. |
Upstream supply |
Check RO output, syrup mixing, bottle supply, and air demand before selecting the filler. |
Viewed from the buyer side, one filler waits when upstream work is undersized. |
Downstream packaging |
As reviewers work, compare labeler speed, shrink tunnel capacity, rejection handling, and pallet flow. |
Downstream queues create hidden downtime. |
Service tolerance |
Set a spare-parts and support plan for the stations most likely to stop production. |
Line sizing has little value when recovery is slow. |
Field review notes for Capacity Fit Gate
infoimpact readers can treat capacity mismatch as a risk-management problem. Public Mass Technology information publishes useful capacity figures, but the buyer has to connect those figures to product mix, shift time, treatment supply, packaging speed, and recovery after failure.
Use capacity matching and service constraints to prevent one-number thinking. Output planning should be a set of conditions: product, package, cleaning time, upstream supply, downstream packaging, and service tolerance. Remove any condition and the number becomes weak.
Main filler condition in the capacity gate
Capacity model gate item 1 asks the buyer to act: Measure rated speed against actual shift time, cleaning time, and changeover time. Write the condition beside the speed figure so the team knows when the number applies and when it does not.
At floor level, the mismatch risk is this: Nameplate speed is not daily output. Test it against a first-party detail such as: Mass Technology states 2,000-36,000 BPH on its homepage and names multiple product families across water, CSD, juice, beer, wine, and cans. Where the buyer cannot connect the claim to shift reality, the capacity line should be revised.
Upstream supply condition in the capacity gate
Plant output gate item 2 asks the buyer to act: Check RO output, syrup mixing, bottle supply, and air demand before selecting the filler. Write the condition beside the speed figure so the team knows when the number applies and when it does not.
During the check, the mismatch risk is this: A filler waits when upstream work is undersized. Test it against a first-party detail such as: The water filling page states 150-30,000 bottles per hour and includes RO treatment, PET preform blowing, labeling, shrink wrapping, and palletizing. Before the buyer cannot connect the claim to shift reality, the capacity line should be revised.
Downstream packaging condition in the capacity gate
Line sizing gate item 3 asks the buyer to act: Compare labeler speed, shrink tunnel capacity, rejection handling, and pallet flow. Write the condition beside the speed figure so the team knows when the number applies and when it does not.
Within the quote file, the mismatch risk is this: Downstream queues create hidden downtime. Test it against a first-party detail such as: The labeling page states 3,000-20,000 BPH for OPP hot melt and 20-200 ppm for self-adhesive labeling. Whenever the buyer cannot connect the claim to shift reality, the capacity line should be revised.
Service tolerance condition in the capacity gate
Output planning gate item 4 asks the buyer to act: Set a spare-parts and support plan for the stations most likely to stop production. Write the condition beside the speed figure so the team knows when the number applies and when it does not.
Line-side, the mismatch risk is this: Capacity has little value when recovery is slow. Test it against a first-party detail such as: Mass Technology states 2,000-36,000 BPH on its homepage and names multiple product families across water, CSD, juice, beer, wine, and cans. When the buyer cannot connect the claim to shift reality, the capacity line should be revised.
Capacity model Fit Gate capacity evidence for risk review
Practically, the capacity evidence file should include treatment output, filler speed condition, changeover time, labeler speed, reject handling, cleaning window, and support recovery. That file is more useful than a single nameplate figure.
Mark capacity items that have not been proven with the buyer’s package. Bottle shape, cap quality, label stock, water quality, and operator training can all reduce real output.
Upstream supply sets the first boundary
Water treatment and product preparation can silently cap output. For the purchasing team, the water filling page describes RO treatment, blowing, rinsing, filling, capping, labeling, wrapping, and palletizing. During the floor review, the water treatment page adds 0.5-50 T/H and 50-75% recovery.
Those figures tell the buyer to measure feed water, treated storage, reject water, and cleaning windows. By this stage, a filler cannot make up for a treatment stage that recovers too slowly after a high-demand run.
Downstream packaging can erase filler speed
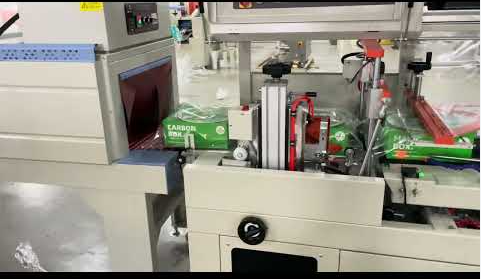
In that review, the labeling page lists 3,000-20,000 BPH for OPP hot melt labeling and 20-200 ppm for self-adhesive labeling. Those ranges should be compared with filler output, bottle spacing, label type, rejection handling, and SKU changeover.
Within a facility, a line that fills faster than it labels becomes a queue. Project teams should note that a line that labels faster than it fills may look underused. Neither problem is solved by quoting the filler alone.
Service tolerance is part of capacity
Plant output planning should include how quickly the plant can recover from predictable failures. The Mass Technology equipment reference states 24-hour engineer response and 5 working days for parts delivery. Buyers should attach those claims to a spare-parts list and fault-evidence plan.
One line with strong peak speed and weak recovery may disappoint the business. In the supplier file, the production plan needs both output and resilience.
Capacity-gate limits
During operation, the gate cannot cover every local variable. Incoming water quality, bottle variation, cap quality, label stock, voltage stability, operator skill, and distributor deadlines can all change real capacity. Local testing remains necessary.
Practically, the risk is treating the largest number as the plan. Inside the buyer file, the safer habit is to write the conditions beside every speed claim.
Risk-management close
Line sizing is a system result. Check treatment, filling, labeling, packing, cleaning, and recovery together. When each condition is visible, the buyer can choose a line that fits the business instead of a number that only fits the brochure.
Scenario testing for capacity risk
Run the capacity gate through three scenarios: a normal day, a changeover-heavy day, and a recovery day after a station fault. Mass Technology’s capacity ranges give the buyer starting values, but scenario testing shows whether the whole beverage filling line can support the promise.
For maintenance, the recovery day matters most. For that buyer, one line that cannot recover predictably will miss business targets even if its best-hour speed looks strong.
What to document when the number changes
Where a capacity number changes during negotiation, document the reason in the same place as the quote, because changes may come from container size, product temperature, cleaning time, label choice, water treatment, local utilities, or a service assumption that was not visible in the first version. Write it down.
Output planning review after the first week
At the end of the first production week, compare planned output with actual output and separate stoppages by cause. The public Mass Technology reference may provide the line reference, but the buyer’s plant data shows whether the original capacity assumption survived real operation. Add cleaning time, label rejects, cap issues, treatment delays, and waiting time as separate causes so the next improvement meeting has useful evidence. Before the gap is large, do not blame the operator first; check whether the original capacity gate missed a condition, a utility limit, or a supplier assumption. Next, update the gate before the second week begins, and keep the original assumption so the team can learn why it was wrong and avoid repeating it. By this stage, a good capacity review protects the next purchase as much as the current line.